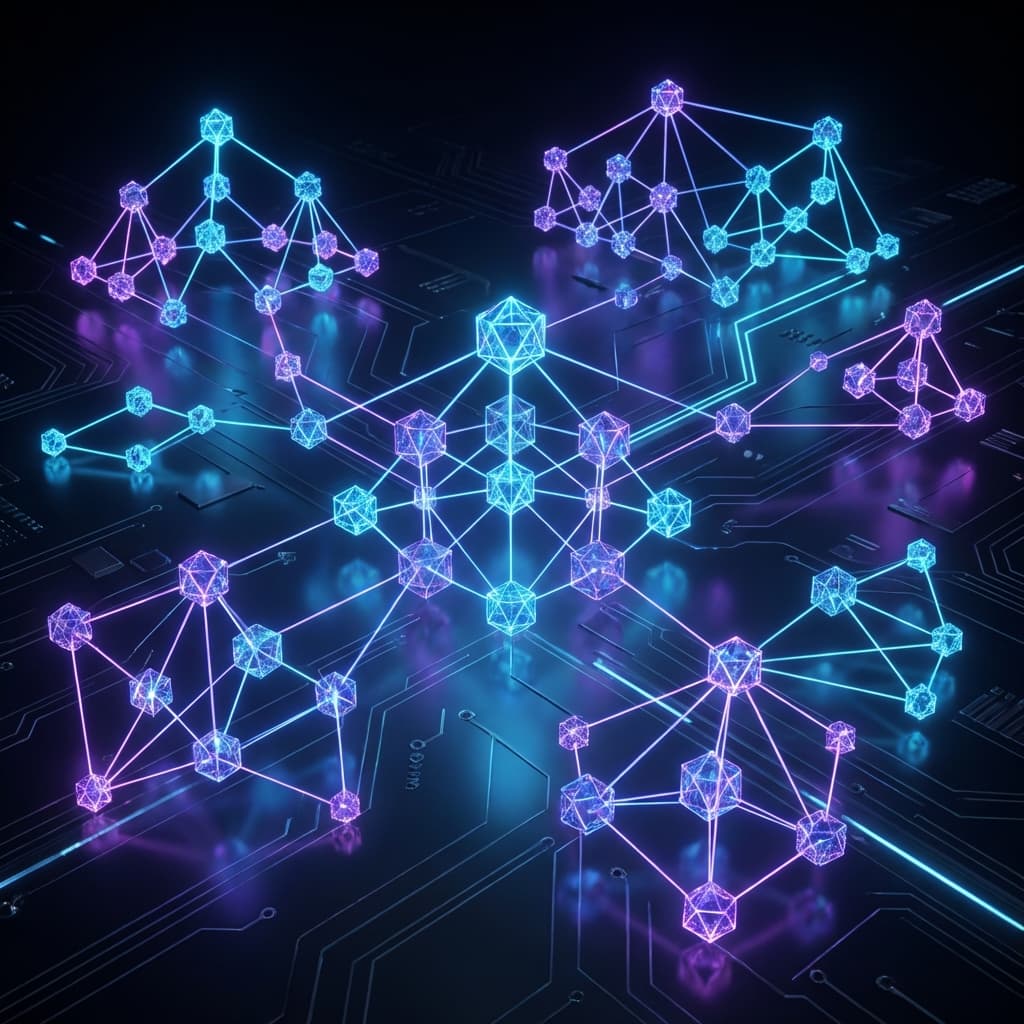
The Front-End for Graph Discovery: Visualizing Reasoning
Show your work. Learn how to build user interfaces that display the 'Logical Path' the AI followed in the graph to increase trust and provide a window into the AI's mind.
The Front-End for Graph Discovery: Visualizing Reasoning
A Graph RAG system that only returns text is a wasted opportunity. The greatest strength of a graph is that it is Visual. If the AI tells you a fact, you should be able to see the Evidence Path on a map. This "Visual Proof" increases user trust by 10x and allows them to perform their own investigations.
In this lesson, we will look at UI Design for Graphs. We will learn how to build a chat interface that includes a "Graph Panel" using libraries like react-force-graph or vis.js. We will see how to highlight the specific nodes the AI touched and how to let users "Explore" the neighbors of an AI's answer with a single click.
1. The "Evidence Bridge" UI Pattern
The UI should be split into two halves:
- Left Side: The Chat. (Typical AI response).
- Right Side: The Graph. (A 2D or 3D visualization of the retrieved subgraph).
The Magic Interactivity: When the user hovers over a sentence in the chat (e.g., "Sudeep approved the budget"), the corresponding nodes and edges in the graph panel should Glow. This creates a physical link between the "AI's Language" and the "Raw Data."
2. Managing Visualization Complexity
If the AI retrieved 100 neighbors, showing all of them in a UI is a "Hairball."
- Pruning: Only show the nodes actually mentioned in the final AI answer.
- Color Coding: Use different colors for different node types (e.g., Blue for People, Green for Projects).
- Tooltips: Clicking a node shows the "Primary Source" (e.g., the URL of the document it came from).
3. The "Double-Click Discovery"
A good Graph RAG UI is an Investigation Tool. If the AI says "Sudeep is working on Project X," the user might want to know "Who else is on Project X?". The UI should allow them to Double-Click the Project X node. This triggers a real-time Cypher query to find the other neighbors, allowing the user to "Walk the Graph" manually.
graph TD
    User -->|Question| Chat[Chat Interface]
    Chat -->|Retrieval| API[RAG API]
    API -->|Result| Chat
    API -->|SubGraph| GP[Graph Panel]

    style GP fill:#4285F4,color:#fff
    style Chat fill:#f4b400,color:#fff
    note[The Graph and the Chat are synchronized]
4. Implementation: A Basic React Component for Graph View
import { ForceGraph2D } from 'react-force-graph';

function GraphResultView({ data }) {
  // data contains { nodes: [...], links: [...] }
  return (
    <div className="graph-container">
      <ForceGraph2D
        graphData={data}
        nodeLabel="name"
        nodeAutoColorBy="group"
        linkDirectionalArrowLength={3.5}
        linkDirectionalArrowRelPos={1}
      />
    </div>
  );
}
5. Summary and Exercises
Visualizing the graph is the ultimate fix for the "Black Box" problem.
- Side-by-side views link narrative to evidence.
- Interactivity allows for user-led exploration.
- Simplification (Pruning) prevents the "Hairball" UI mess.
- Synchronization: The Chat and the Graph should feel like one single experience.
Exercises
- UI Design: Sketch a layout for a "Medical Research" bot. How would you display the link between a "Drug" node and a "Side Effect" node in the chat?
- The "Hairball" Fix: If you have 1,000 nodes, what is the best way to show only the "Path" the AI took without losing the context?
- Visualization: Draw a chat bubble on one side and a 3-node graph on the other. Draw a "Glow" line connecting a word in the bubble to a node in the graph.
In the final lesson of this module, we will look at stability: Building a Production Monitoring Suite.